¶ Forest Resource Assessments
The Uganda Forestry Policy, 2001 commits the Government of Uganda to actively protect, maintain and sustainably manage the current permanent forest estate for the conservation of biodiversity, protection of environmental services, and forest production for domestic and commercial purposes”[1].
Currently, only PAs constitute the country’s permanent forest estate. Outside the PAs, the policy enjoins government to promote sustainable management of natural forests on private land and promote profitable and productive forest plantation businesses[2]. Sustainable forest management (SFM) requires that the FP knows what is in the forest they are managing, and this knowledge comes from forest resource assessments.
Section 37 of the Forestry Act requires the Minister to carry out an inventory of all forests in Uganda. In pursuit of this requirement, the Forestry Regulations require that the inventory is done once every 10 years, or shorter periods if the Minister so determines. Therefore, until the degradation of the forests is reversed:
Instruction 77: MWE shall assess the forestry resource base of the country at least once every five years to guide the country’s forest restoration efforts, sustainable harvesting of products, and planning investment in the management and conservation of forestry resources.
The assessments that are commonly undertaken are mainly for production and biodiversity conservation purposes. There are a number of practices that can be used to carry out forest resource assessments, employing technologies that range from low ground plots, to high resolution remote sensing technologies. Key resource assessments include:
(i) Timber stand Exploratory Inventory (EI) in natural forests;
(ii) Integrated Stock Survey and Management Inventories (ISSMI) in production zones of natural forests;
(iii) Inventory of timber plantations;
(iv) Permanent Sample Plots (PSPs) in natural forests and plantations;
(v) Inventory of Other Wooded Lands (OWLs);
(vi) Biodiversity inventories;
(vii) Biomass inventories;
(viii) Diagnostic sampling in natural forests;
(ix) Assessment of degraded natural forests for purposes of restoration; and
(x) Landscape inventories using remote sensing technologies.
NFA has developed field guides that are appropriate for application at FMU level, which will require periodic revision in view of the technological advancements that are taking place. More important is the need for using these guides in the day to day management of forest resources. NFA headquarters staff are quite knowledgeable, but field staff still lack the skills, and so field activities are getting more and more centralized leaving FMU staff with fewer and fewer technical operations to carry out. This tends to create a heavily top-down forest management approach, which in turn leads to apathy among field staff.
Instruction 78: Forest resource inventories shall always be planned and executed by combined teams of Headquarters and FMU staff. The main role of Headquarter staff should be to lead in the planning of the inventories and supervise field activities. FMU staff shall take part in the planning, and carry out most of the field activities.
¶ Exploratory Inventories in Tropical Moist Forests
EI is a low intensity inventory (1%), which provides information about the forest tree stock in Tropical Moist Forests (TMFs). It shows the available species in a forest, giving indications of their stem quality and size classes, the total quantities available, and distribution at the compartment level. The information can be used to decide at a FMU level which species to be promoted and/or protected, appropriate diameter class limits, and to sequence the compartments into felling series. Approximate annual allowable cut for the forest is also determined through a growth model called Eipac, which has been specifically designed to analyze natural forest inventories. The growth model gives the level of harvesting that may be permitted and encouraged. The information can also be analyzed at the species level for those species under pressure. EI data is used in the preparation of FMPs. However, it does not give sufficient information for planning at, or below the compartment level. The main features of EI are:
(i) The design is a stratified, partially randomized 1% sample. Stratification is by 1-km square blocks oriented in the North South – East West directions (Figure 3).
Figure 3: Design of Exploratory Inventory
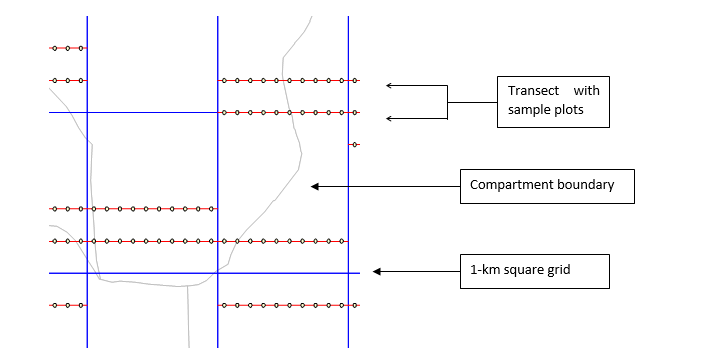
Source: NFA, 2008. A Field Guide to Exploratory Inventory in Uganda’s Tropical Moist Forests in Central Forest Reserves
(ii) Within each block, 2 transects are laid at random in an East West direction, but the transects are constrained in multiples of 200m in between (i.e. the distance between any two transects can only be 200, 400, 600, 800 or 1000m. The location of transects may be pre-determined in a computer or they can be determined in the field with dice.
(iii) Along transects, plots are established at 100m intervals, starting 50m in from the beginning of each transect. Each plot is circular with a radius of 12.6m (500m2 or 0.05ha).
(iv) Within each plot, all trees down to a diameter at breast height (dbh) of 20cm are measured. In the North East quadrant of the plot, trees down to 10 cm are also measured.
(v) The design gives 20 plots of 0.05 ha each per square km giving a sampling intensity of 1%.
(vi) The data is analyzed for various stand tables and for estimation annual allowable cut (See example in Table 2).
Table 2: An Example of EI Stand Tables (Volume in M3/ha)
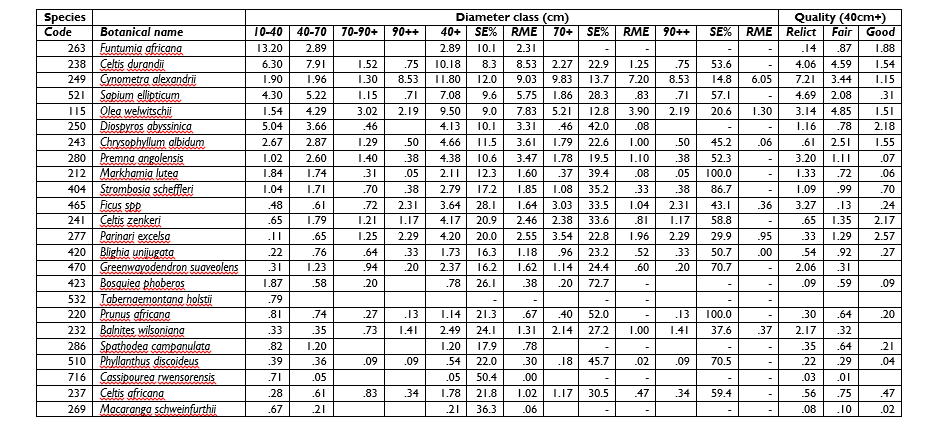
Source: Extracted from Exploratory Inventory for Itwara Forest Reserve, 2005
With the emergence of monitoring, reporting and verification for carbon, dead wood and tree stumps have been added to the elements that are measured, and accordingly added to the datasheets. In addition, the position of each tree is recorded by taking the distance of the tree from the plot centre and the compass direction (or GPS coordinates of the tree).
Instruction 79: Activities at the office shall involve creation of EI blocks (1km x 1km) on a map covering the area to be assessed, generation of randomized transects, mobilisation of equipment and tools, and recruitment of the assessment team involving forestry technicians and workers. The map shall then be uploaded into the GPSs to be used in the field.
Instruction 80: Field activities shall involve:
(i) Training the team members at the place where the inventory is going to take place, laying out the map grid that defines the blocks and the associated transects on the ground using a GPS, and laying out inventory plots.
(ii) Each block is marked with an “L” trench 40 cm deep by 40 cm wide by 1.5 m long constructed at the South-western corner as a permanent infrastructure that is useful to guide subsequent operations.
(iii) Enumeration of all trees of 20 cm diameter and above in each inventory plot.
(iv) In the North Eastern quadrant of the plot, trees of 10 cm diameter and above are enumerated to get an idea about the upcoming stock.
(v) Analogue datasheets may be replaced by digital ones which are uploaded on tablets and smartphones, depending on the equipment available at the FMU
Instruction 81: Back at the office, the field data forms shall be entered and analysed using the Eipac computer programme. The main outputs of the EI exercise include:
(i) Stand table of tree volume for each species for each compartment, and for the whole forest.
(ii) Stand table of number of trees per km2 for each compartment, and for the whole forest.
(iii) Basal Area per hectare.
(iv) Forest inventory summary of the most common species.
(v) Annual allowable cut and felling series for the forest.
(vi) Projected volume or number of trees per felling cycle for three cycles (about 90 years).
Details of the EI Practice are given in the Field Guide to Exploratory Inventory which can be obtained from NFA. The Guide gives a detailed description of the field procedure, includes diagrammatic representations of some of the steps, annexes that detail the site and tree condition codes to be used during tree enumeration, and presents the EI Plot Enumeration Form.
¶ Integrated Stock Survey and Management Inventories
ISSMI is practice that has been developed by NFA to be applied in natural forest timber production zones. The guide integrates and provides for:
(i) Selective harvesting that facilitates sustainable timber harvesting in TMFs;
(ii) Effective management the highly diverse small FMUs;
(iii) Monitoring responsible harvesting and affirmative silviculture;
(iv) Continuous inventory that shows how the forest is developing over a long time;
(v) Auditing through Uganda’s NFSS; and
(vi) Enabling local people to be licensed for harvesting on account of the small affordable units (4-ha blocks).
ISSMI is carried out only in compartments that are due for harvesting, according to the information provided through EI. It is the beginning of the polycyclic operations within the timber harvesting rotation.
Instruction 82: When a compartment has been assigned for felling within a given felling series[3] , the ISSMI operation shall be performed about two years before felling to allow for the rotting of climbers cut around climber infested trees.
Instruction 83: During ISSMI, total enumeration of all trees that have reached the minimum diameter for harvesting (stock survey) shall be carried out. Annex 5 presents the minimum harvesting girth/ diameters of some species as given in Schedule 17 of the National Forestry and Tree Planting Regulations, 2006. The minimum diameters for the species not included in the annex shall be established by NFA in a study that includes examining stand tables generated though EI, followed by destructive felling and measurement of trees during the harvesting of trees after ISSMI. NFA may out-source a researcher/ consultant for this.
Instruction 84: The management inventory shall be carried out in 0.01 ha temporary sample plots using a systematic sampling intensity of 5% (Figure 4). In each temporary sample plot, information shall be recorded for all trees/poles down to 10 cm diameter. In addition, observations about the site (e.g. climber tangle, agriculture, forest fire, gap from recent felling, etc.) shall be recorded. The information gathered will be used to construct stand tables and to guide decision-making regarding subsequent management actions.
Figure 4: Layout of Lines and Temporary Sample Plots in an ISSMI Block
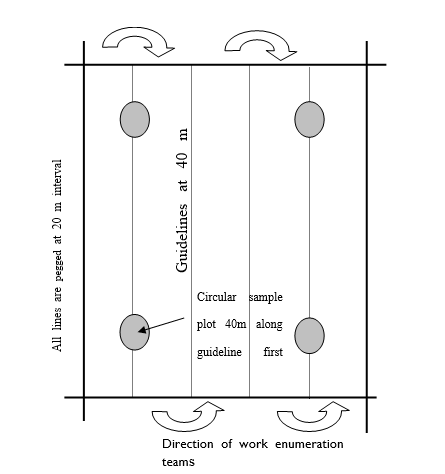
Source: NFA, 2005. A Field Guide to Integrated Stock Survey and Management Inventory
Instruction 85: During ISSMI:
(i) A network of 200m x 200m strip and block lines shall be used to form four-hectare blocks which are demarcated semi-permanently on the ground as basic units of management.
(ii) All potentially harvestable trees shall be marked and recorded.
(iii) Information for control of felling in each block shall be provided.
(iv) Infrastructure for subsequent management operations shall be provided.
(v) Additional information on the silvicultural status of the standing crop down to pole-sized trees shall be provided from temporary sample plots.
(vi) Analysis and presentation of inventory information shall be recorded in convenient and readily accessible datasheets (analogue or electronic) user-friendly formats, using a specially designed computer programme.
(vii) A continuous forest inventory shall be provided for.
Instruction 86: All data from field measurements shall be entered in the Eipac database immediately after the field exercise, and the data cleaned while the data is still fresh from the field so that any inadvertent mistakes can be checked out. The data shall then be processed to produce the various stand tables in order to inform forest management operations like harvesting, marketing, and stand improvement.
An example of the ISSMI stand table is given in the extract shown in Table 3.
Table 3: An Example of an ISSMI Stand Table
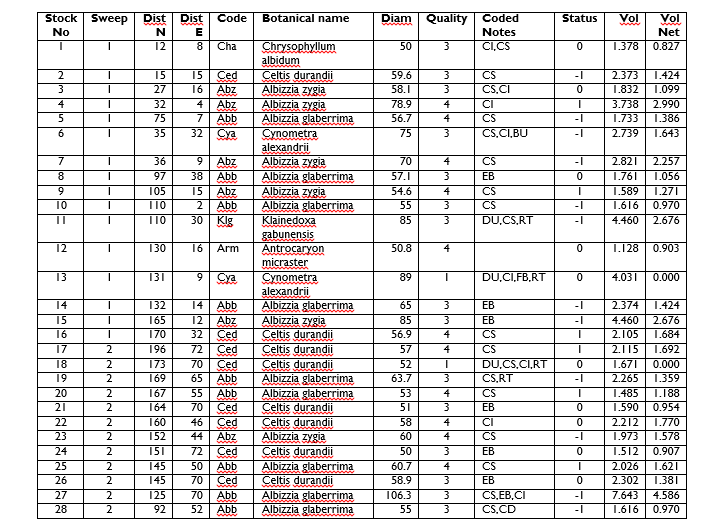
Source: Extract from Budongo CFR, CPT B5C, ISSMI Block 64
Details of the ISSMI Practice are given in the Field Guide to Integrated Stock Survey and Management Inventory which can be obtained from NFA. The Guide gives a detailed description of the field procedure, including diagrammatic representations of some of the steps.
¶ Inventory of Timber Plantations
¶ Inventory by Permanent Sample Plots
Forest plantation inventory is crucial for generating information for long-term plantation planning, taking day to day management decisions, and assessment of the plantation value. This is best done through PSPs. The object of the PSPs is to collect continuous data on the performance of plantations without which planned management is difficult. It is, therefore, essential that the PSPs are treated in exactly the same way as the crop in which they are situated.
PSPs provide information on stand growth, the potential productivity of the site, the effects of silvicultural treatment on growth and yield, and changes in site productivity over successive rotations of tree crops. Key considerations in establishment of PSPs in timber plantations are given in the Instructions below:
Instruction 87: All pine and eucalypt timber plantations over 400ha should be sampled using circular PSPs. The sites should be selected using stratified random methods (Forestry Department, 1997)[4].
Instruction 88: PSPs should cover the range of species, age-classes and site classes in the forest. One PSP for each 15-25ha is a good guide.
Instruction 89: The size of plot shall be determined by the spacing of trees in the stand. As a guide, each plot should be big enough to include 15-25 trees. Common circular plot sizes are 0.02ha (8m radius); 0.04ha (11.3m radius); and 0.05ha (12.6m radius). For well stocked pine and eucalypt plantations in Uganda, the 0.02ha plot will be sufficient.
Instruction 90: PSP infrastructure should include directional trenches, and a pillar to mark the plot centre, but it is preferable to keep the mark inconspicuous (and keep GPS coordinates of the plot centre) so that management is not biased.
Instruction 91: The exact location of the PSPs shall be marked on a large-scale map (1:10,000 or larger), and where possible, each PSP’s centre may be recorded using a GPS.
Instruction 92: All trees in the plot shall be marked with permanent paint at 1.3m height, and numbered with paint or metal tags.
Instruction 93: All dbh shall be measured with dbh tapes or suitable callipers. In addition, the heights of at least 2 of the tallest trees in a 0.02ha plot shall be measured to give Dominant Height, later to be used in volume models.
Instruction 94: Information on condition of the plot, e.g. burnt area, presence of pests and disease, silvicultural treatments, etc. shall also be collected.
Instruction 95: If a PSP is being re-assessed, data from the previous assessments should be available with the assessor so that errors (e.g. a higher number of trees in the plot, or a dbh that has seemingly become smaller) can be promptly corrected.
Instruction 96: PSPs shall be established not later than two years after planting [5], and re-measured every two years in the early phase of establishment, with the interval increasing in the latter growth phases.
Instruction 97: PSPs shall be thinned and pruned at the same time as the rest of the crop.
Instruction 98: PSP’s shall be spread over the entire plantation, representing as many site conditions and silvicultural practices as possible, with each stratum being covered by a minimum number of PSPs. That means, the larger the stratum the more PSPs in that stratum. On the other hand, one small and highly valuable stand can be assessed as one PSP. The time frame for measurements shall cover the entire life of the stand.
Instruction 99: An effective PSP system requires long term commitment in staff time and resources to establish and maintain the PSP’s and the associated database. The actual establishment and field work can be done by different FMUs, but a centralized data management approach shall be necessary to afford comparability in the respective data sets, and ensure accessibility of the data.
More details on PSP establishment and assessment can be found in the documents referenced above. The documents are stored in the libraries of NFA, FSSD, and DFOs.
¶ Inventory by Rapid Assessment
Instruction 100: In already established plantations where no PSPs were established, temporary sample plots may be used, especially during preparation of a harvesting plan. The technical considerations remain as outlined above, with the exception of establishing permanent plot infrastructure. The sampling intensity may also be higher.
¶ Permanent Sample Plots in Natural Forests [6]
PSPs provide estimates of annual allowable cut, sustained yield, assessment of forest response to different felling minimum girths, felling cycles, and silvicultural treatments, which depend on growth, mortality and recruitment rates in an FMU. PSPs provide the empirical basis for these parameters and, therefore, PSPs are a key requirement for SFM.
A sampling intensity of 0.08%, or one PSP (1 ha) for every 1250 ha of forest provides a sufficient number of plots for effective growth and yield estimation without loading the forest management budget with excessive recurrent costs for PSP maintenance.
Instruction 101: The following criteria for locating PSPs in each FMU should be used:
(a) For purposes of timber production, only the more productive forest types should be sampled. Areas that are degraded or have high concentrations of non-commercial species (e.g. pure Broussonetia stands) should be avoided to minimize costs.
(b) Small, fragmented forests, or localities under intense population pressure should be avoided. The PSPs are unlikely to survive for a long period. Likewise, areas within 500 m of public roads, external forest boundaries or settlements should be avoided.
(c) In FRs where PSPs had been established before, the old PSPs shall be located first before creating any additional ones, subject to the above constraints.
(d) PSPs established in each forest should, as much as possible, be distributed to depict the major vegetation and topographical variations.
(e) The PSPs should be measured once every 5 years, and the access paths and directional trenches re-opened at least once every year. During maintenance, paint rings that are fading or peeling off shall be renewed.
(f) All data from field measurements shall be entered in the PSP database immediately after the field exercise, and the data cleaned while the data is still fresh from the field so that any inadvertent mistakes can be checked out. Every 5 years, the data shall be processed for purposes of yield regulation (estimates of annual allowable cuts, sustained yield, assessment of forest response to different minimum girths, felling cycles), and adjustments in silvicultural treatments for each FMU.
Instruction 102: NFA shall develop and keep updated detailed Standard Operating Procedures for establishment, assessment and maintenance of PSPs in natural forests.
¶ Inventory of Other Wooded Lands
Other wooded lands (OWLs) are commonly called “woodlands” in Uganda. The canopy cover of trees is less than 5 percent but the combined cover of shrubs, bushes and trees may be more than 10 percent. The land may include areas of shrubs and bushes where no trees are present. OWLs also include areas with trees that will not reach a height of 5 meters in situ, but with a canopy cover of 10 percent or more [7].
The Point-Centred Quarter Method is useful and practical in carrying out an inventory of OWLs. It is especially suited to small – medium scale FMUs (for example in a community forest), where it may not be possible to use other technically and financially demanding inventory methods. It gives a good estimate of what is in the forest in terms of plant density and species composition and dominance. DFOs and Sector Managers working with private forest owners will find it particularly handy in their work of providing forestry advisory services to private forest owners and forest dependent communities who would like to carry out productive management of their OWLs.
It is a “plot less” method because it does not require dividing the area into distinct units like most other inventory methods. Because there is no need for laying out a grid, the method is easy and fast to use. It is specifically suitable for sampling plant communities of widely spaced shrubs or trees. Depending on scope and intensity of work, the method can easily be adapted to technology that is also available on smart phones to record attribute information such as species, diameter, and bole height, among others.
Instruction 103: The Point-Centred Quarter Method outlined below should be used to carry out an inventory of OWLs, especially by those offering forestry advisory services to small scale OWLs of low tree densities among local communities. The main steps are outlined below.
(a) Where possible have the FMU mapped and stratified if necessary
(b) Cut a light line across the forest or stratum (transect line).
(c) Mark off stations at random or at systematic intervals along the line, and record their GIS coordinates to aid mapping and location.
(d) Lay out imaginary lines perpendicular to the transect line at each station, giving 4 quadrants at each station
(e) At each station, record the tree nearest to you in each Quadrant. The information to be recorded shall include species, distance in metres from the station, diameter at breast height (dbh), and bole and crown heights. Include only trees which are 10cm dbh and above.
(f) Record and take GIS Coordinates of large gaps, encroachment, illegal activity, non-timber forest products (NTFPs), streams, etc. that can be seen from the station
(g) Compute the data gathered in the field to show:
• Different species available in the forest.
• Density of trees in the forest giving an indication of level of stocking.
• Species that are abundant in the forest.
• Whether it is possible to harvest at sustainable levels or not.
• An indication of follow up activities to improve the quality of the forest.
The detailed Point-Centred Quarter Method is presented in Annex 6.
¶ Biodiversity Inventories
Biodiversity is the variety of ecosystems, habitats and genes. The goal for Uganda’s National Biodiversity Strategy and Action Plan, 2016 is “to enhance biodiversity conservation, management and sustainable utilisation and fair sharing of its benefits by 2025”[8]. Periodic biodiversity inventories, and inventories under Environment and Social Impact Assessment (ESIA) studies are an essential component of keeping track of progress in achieving this goal.
Humanity depends on ecosystem services like fresh water, pollination, soil fertility and stability, food and medicine. Thus, degradation of ecosystems leads to inadequate delivery of those services, especially in view of the high population growth rates in Uganda. Degradation of ecosystems is also responsible for 11% of all global greenhouse gas emissions caused by humans [9], and so conserving forests would stop the release of these gases into the atmosphere. Trees and plants also store carbon in their tissue, making it even more necessary to protect them. Over 20 prescription drugs, including for cancer and asthma treatment, sold worldwide have been derived directly from plants found in rainforests.
There is a close link between disease outbreaks and the degradation of nature. About 70% of emerging viral diseases have spread from wild animals to humans. Examples include HIV/AIDS, the West Nile virus, encephalitis, severe acute respiratory syndrome (SARS), Ebola, Marburg, and the more recent COVID19 [10]. When habitats are destroyed, wild animals come into contact with local human communities, hence the zoonotic attacks.
Forests and wetland ecosystems provide crucial buffers to extreme storms and flooding related to climate change. These ecosystems are complex, which means they function best, and are more resilient to the effects of climate change, when all the pieces of the ecosystem are in place. At least 80% of the needs of the world’s poor are derived from biological resources. About 75% of global food crops rely on animals and insects such as bees to pollinate them, but many of these pollinator populations are declining. Millions of people also depend on nature and species for their day-to-day livelihoods. This is particularly true for struggling communities in developing countries, who often turn to high-biodiversity ecosystems as their source of food, fuel, medicines and other products made from natural materials for their own use and as sources of income. Nature-related tourism is also a significant income generator for many people as well[11]. Up to 90% of trees and plants in tropical forests rely on animals to propagate their seeds, but human activity has put these animals at risk and reduced their numbers in tropical forests by as much as half[12].
Instruction 104: Biodiversity inventories are time consuming and expensive as they require use of many types of expertise and administrative experience. Therefore, in order to make sure that a biodiversity assessment exercise is carried out effectively and efficiently, the checklist below shall be followed while planning for forest biodiversity assessments.
(i) Identify the purpose for the inventory, e.g. a legal requirement for ESIA, updating a strategic or management plan, and a requirement for forest certification, among others.
(ii) Specify the information that is required, e.g. Climate, Community & Biodiversity and Verified Carbon Standards requirements.
(iii) Define the geographical scope (area) to be inventoried (using GIS tools), often the FMU or a landscape/ national inventory.
(iv) Determine the data to be collected e.g. indicator taxa/ species.
(v) Review available information and determine how it will be used during assessment, e.g. International Union for the Conservation of Nature (IUCN) National Redlist for Uganda, manuals for species identification.
(vi) Agree on methods to be used during the assessment, e.g. measurement techniques, stakeholder consultations, links with herbariums, templates for field work.
(vii) Consider the resources needed to conduct a successful assessment exercise, e.g. budget, expertise, equipment, transportation, and mapping needs.
(viii) Develop a checklist for the assessment, and consult stakeholders and data holders
(ix) Consider the administrative and social obstacles that may arise and how to solve them
(x) Provide for quality control of the results.
(xi) Develop and pre-test the assessment tools.
(xii) Undertake the assessment exercise.
(xiii) Undertake analysis of the data to produce a biodiversity assessment report.
Instruction 105: Prior to the start of field work, the assessment team members shall be trained in applying the assessment methods chosen.
In the case of the biodiversity assessment programme of the former Forestry Department in the 1990s, over three months intensive field training was given to the forestry technicians (forest rangers, foresters, and forest officers). However, this period can be reduced, depending on the skills the staff have, and the skills needed to effectively cover the taxa selected. The training will also make it possible to replace any previously trained team members that may have left the FMU.
Instruction 106: For purposes of this Handbook, the approach taken by the biodiversity inventory programme of the former FD has been adopted and should be applied in protected areas. The approach may also be adapted by FMUs outside PAs. The key steps are outlined below;
(i) Depending on the objectives of the assessment, the indicator taxa (e.g. selected classes, families, or even species and sub-species) to be surveyed may include any combination of the following: trees and shrubs, mammals, birds, butterflies and moths, amphibians, and reptiles, among others. For purposes of application at FMU level, the selected indicator taxa/ species should be:
• Easily sampled by technical staff, using locally available technologies
• Comprehensively sampled, so that reasonably complete species lists can be made within the time available.
• Accurately identified using locally available expertise, literature and reference collections.
(ii) To standardise the sampling exercise, sampling may be approached from the time needed to assess a given area (e.g. 100ha per day). In this way each individual tree, bird or object being measured will have the same chance of being identified, whether it occurs in a big or small reserve, or anywhere in the forest. This provides a basis for comparing sites, compartments, or even FRs in a given FMU with multiple FRs
(iii) Because of the costs of engaging external specialists, it is advisable to constitute permanent assessment teams whose members are selected from the Sector Managers, Forest Supervisors, and DLG Forest Officers in a given NFA Range. Such a team will be available to LFRs and local community forest owners whenever the need arises.
(iv) Each inventory team should have a mix of expertise equal to the task at hand, and it may take on additional expertise if needed.
(v) Field and analysis methods for each of the five taxa used in the Forest Department biodiversity inventory in the 1990s are described in Chapter 14 of the Nature Conservation Sourcebook for Forestry Professionals (1995)[13]. These methods may be modified depending on objectives of the assessment, current technology, and the time available for the assessment exercise.
(vi) Throughout the field operation, strict recording procedures shall be maintained in order to track the rate at which species which had not been recorded previously are being discovered at each forest with increased sampling effort. Ideally, sampling should continue until the majority of species present at a site have been recorded, as indicated by a slowing of the species accumulation rate. At some point, the return on effort (and cost) is no longer worthwhile, and it is better to spend time assessing another site.
(vii) To minimise errors in identification, two voucher specimens (with a full written description of every species encountered – including common ones) shall be collected and its identity cross-checked and confirmed with specimens stored at Makerere University Herbarium, or other herbaria (e.g. East African Herbarium, Nairobi, or the Royal Botanical Gardens, Kew).
(viii) Basic data analysis shall include compilation of species lists to enable identification of species that are of bio-geographical and conservation significance, and those which were previously not known to occur in the geographical area where the FMU is located.
Instruction 107: Because of the pressure on Forest Reserves and forests outside PAs, biodiversity assessments shall be done at least once every 5-10 years, depending on the degree of pressure on a given forest.
¶ Assessing Degraded Natural Forests for Purposes of Restoration[14]
Forest degradation is normally a process that starts with illegal removal of timber, especially when the forest is under pressure by the neighbouring population, or where protection is non-existent. The people will normally take timber species of economic value resulting in qualitative degradation of the forest. If the illegal activity is not checked, illegal charcoal burners and firewood cutters soon come in. This clears the forest of all trees leaving shrubs and climber tangles and completely destroys the normal structure of the forest, leading to quantitative degradation. If illegal activities are not checked, agricultural encroachments may set in accompanied by human settlements. Therefore, the first line of action in improving the productivity of a degraded forest is effective protection. Otherwise, any other efforts will be rendered ineffective, as illegal activities will continue to remove young trees as they reach pole stage.
The most efficient method of determining the stock composition of a TMF is to carry out an EI covering the whole forest or part of it. But because of its high costs in terms of financial and personnel requirements, EI cannot be carried out as, and when the FP at FMU level needs the information. The most affordable method of determining the floristic composition and stand structure of a TMF is by diagnostic sampling.
Diagnostic sampling can be carried out at FMU level by local staff. It can also be carried out only in one or more compartments where the need to find out the necessary information is most urgent. Timing of the diagnostic sampling exercise of a particular FMU can be scheduled to coincide with periods during the year when staff are less pressed with urgent work such as planting.
In a normal TMF, the main objectives of diagnostic sampling are to:
(i) Find out the silvicultural and economic condition of the remaining trees
(ii) Determine the activities that are necessary for restoration of the forest functions.
(iii) Discover impediments which are curtailing expected growth of the most valuable tree species.
(iv) Guide decision makers as to what actions should be taken to restore the integrity and floristic composition of the forests
Instruction 108: The personnel required for diagnostic sampling are those in charge of the FMU, such as one Forest Supervisor, one skilled worker and two patrol persons. Such staff are regular employees of the FMI and shall carry out the diagnostic sampling operation within their annual budget.
Instruction 109: The key practical steps that shall be followed in assessing the degree of degradation are outlined below:
(i) Open the FMU boundaries and ensure that all lines conform to the boundary plan of the forest.
(ii) Determine the sampling intensity. This may range between 0.5% and 2.5% depending on the degree of accuracy required. It may be low if only a list of species and number of individuals is needed, but it may be higher if stand tables on the basis of timber volumes are expected.
(iii) Determine the size of each sample plot, on the basis of the time available and the urgency of information being sought, but it can range between 0.01ha to 0.5ha. For a rectangular plot, keep the width at 10 metres, and thus determine the length. E.g., a rectangular plot of 0.1ha = 10,000/10 = 1000m2 (Figure 5).
Figure 5: Field Design of Diagnostic Sampling

Source: NFA, 2007. A Field Guide for Assessing and Restoring Growth and Development in Degraded Natural Forests in Uganda
(iv) Determine the intervals between sample plots. About 200 metres is recommended but this can be adjusted in line with the sampling intensity (lowered if the size of the forest/compartment is small or raised if the FMU is large).
(v) Determine average length of each transect. This will be the average width of the compartment/forest as determined from a north-south grid of the scale on the map.
(vi) Determine the interval between transects on the basis of the sampling intensity, and the length and width of each sample plot.
(vii) The first plot boundary is located 100m inside from the external boundary (cairn or beacon or any other permanent mark on the ground) along the transect line. This is necessary as it will help to locate the transect again in case it is needed for some other sampling or in case it is decided to transform some of the sampling plots into PSPs.
(viii) Two types of data shall be obtained, namely a count of each individual tree species and diameter measurements of all trees of 10cm dbh and above. Other high conservation or economic value non-tree plant species can also be included in the assessment.
(ix) Indicate the presence of climbers and other site condition types (e.g. encroachment, illegal tree felling, enrichment planting, etc.). This will help managers to note where and why tree growth is being impeded, absent or threatened, so that appropriate action such as climber cutting, replanting and with what species, increased protection, etc. can be taken.
(x) The data should be analysed and summarized to indicate tree volumes, basal area and numbers per hectare (stand tables).
Details of the Practice are given in the Field Guide for Assessing and Restoring Growth and Development in Degraded Natural Forests in Uganda, which can be obtained from NFA. The Guide gives a detailed description of the field procedure, including diagrammatic representations of some of the steps. The Guide has appendices showing:
(i) An enumeration form for species names and their occurrence by sample plots. The form can also be designed for use electronically
(ii) Diagnostic sampling summary of basal area form; and
(iii) Examples of data summarized from the enumeration form, stocking of trees and corresponding basal areas for each species that will form the next timber crop.
Once the condition of the forest is known, a decision is taken either to enrich the whole forest or parts of it, liberate regeneration, intensify protection only, or carry out a combination of any of these.
¶ Inventory of Trees in Urban Areas
Uganda has not yet developed a home-grown practice for assessment of trees in urban areas. Therefore the method outlined below has been slightly adapted from one developed by the United States Forest Service. The method generates primary data from on-the-ground inventory as opposed to aerial or satellite imagery[15].
(i) Where there are forest patches in the urban area, establish temporary stratified random sample plots, each 0.05ha (circular plot of 12.6 metres radius), using two plots per hectare, or sampling intensity of 10%
(ii) The plot centres are generated and located on a map of the urban area, using the GIS tools which shows the forest patches. The plots are located along the East-West or North South transects for ease of location on the ground with a GPS.
(iii) This map is then used to locate the plot centres on the ground. 10% of the total number of plots is added to cater for plots that may have to be abandoned because they have fallen in undesirable places on the ground, e.g. on a road, a recently cleared or built up area, etc.
(iv) Where the trees are not in forest patches, but are growing along streets or in parks, a 100% inventory is carried out. For purposes of this guide, all these different forest/ tree configurations are referred to as blocks
(v) The following parameters are commonly recorded for each tree:
• GIS coordinates for each tree, especially for trees in a park or street, and trees that will need to be removed, undergo tree surgery, etc.
• Species – the tree is identified and its botanical name determined. Where it is not possible, samples of leaves, flowers, bark, etc. are taken for identification later at the office or at other herbaria
• Diameter of the stock trees – measured at breast height for all trees above 10cm diameter. However, for buttressed or fluted trees, it may be necessary to take the diameter above breast height.
• Number of upcoming saplings (less than 10cm diameter but 2 or more metres tall)
• Crown cover diameter
• Nature of regeneration in one quadrat of each sample plot: species, number of seedlings (<2 metres tall)
• Quality Codes – assigned to indicate the condition of the trees, e.g. vigour (score), severely damaged tree, tree too close to a utility or building, tree needing tree surgery, etc.
• Site observations (coded) e.g. cultivation, illegally felled tree, climber tangles, illegal building, stream crossing, through road, etc.
• Remarks – Any other information about the tree that is relevant and important to take note of.
(vi) The data is recorded in datasheets and analysed to produce:
• Stand tables of tree volume for each species for each block, and for the whole urban area
• Stand tables of number of trees, saplings and seedlings per ha for each species for each block, and for the whole urban area
• Basal area per hectare (trees 20cm +)
• Forest inventory summary of the most common species
• Block maps showing location of trees needing management action
• Any other information necessary for good management of the urban forest/ trees
Instruction 110: With the help of the MWE, each Urban Authority shall develop a detailed field guide for inventory of urban forests and trees. The steps outlined above may be used as the starting point for this.
Instruction 111: Inventory of urban forests shall be carried out once every five years, and this inventory shall feed into the inventory that is legally required of the Minister in Section 37 of the Forestry Act, and Schedule 12 of the Forestry Regulations.
¶ Landscape Inventories
Because forest landscapes are often large, it will not be economically feasible to apply FMU practices to assess the forest resources at this level. Remote sensing practices should be adopted where the forest landscape is large (e.g. a Water Management Zone, the Albertine Graben). Remote sensing applications can be used in particular to determine the extent of different land-cover (or land-use) classes, such as is used by the National Biomass Unit of NFA. This can greatly assist in extrapolating volume and biomass densities generated by field-based measurements, over large areas and over time in repeated assessments, to estimate changes in total volume and biomass stocks, across a given landscape[16].
Instruction 112: Each FMI shall adopt the appropriate methods and develop detailed step by step guidelines for each of the methods so that all staff are able to operate from a common understanding, and so that over time, the products can easily be matched and reconciled. This will involve reviewing existing guidelines, compiling procedures that are available but not yet formally constituted into guidelines, or develop new guidelines.
¶ Management of Inventory Data
Instruction 113: At various levels of each Government FMI, staff shall be given training to manage entry and process data that will be coming in from various sections and levels of the FMI. At the Ministry, the database manager should be positioned at Headquarters (a senior officer to manage the central database). At NFA, the database managers should be positioned at Headquarters (a senior officer to manage the central database), at the Range, Sector, and FMU (Supervisor) levels. At district level, the database manager shall be stationed at the DFO, and linked to the information management systems in the district planning offices.
Instruction 114: User friendly data collection formats should be developed for use at FMU/ Community level. These could be tailored for use with a Smart Phone, a Tablet, GPS unit, or even hard copies designed so that field data can be entered in excel spreadsheets.
Instruction 115: Modelling for growth or future yields requires sound scientific knowledge and inclusion of parameters not otherwise collected directly during the inventory (e.g. on climate). Thus, the FMIs should collaborate with education and research institutions who may be requested to do periodic modelling using the datasets in the central database.
Policy Statement No. 1: On Forestry on Government Land ↩︎
Policy Statements No. 2 and 3 ↩︎
Area to be harvested over the 10-year FMP period ↩︎
Departmental Standing Orders, 1997 ↩︎
Adapted and summarized from: Paul Jacovelli, et al, 2010. Tree Planting Guidelines for Uganda. Sawlog Production Grant Scheme, Supported by European Union from 2004 to mid - 2009 ↩︎
NFA, 2006. Management of Tropical Moist Forests in Uganda – Reports on Development Work; with Support of Dr. Denis Alder ↩︎
FAO, 2018. Terms and Definitions. Global Forest Resources Assessment, 2020) ↩︎
National Environment Management Authority (NEMA), 2016. National Biodiversity Strategy and Action Plan (2015 – 2025), 2016. ↩︎
https://www.conservation.org/stories/11-climate-change-facts-you-need-to-know ↩︎
https://www.sciencedirect.com/sdfe/pdf/download/eid/3-s2.0-B9781455748013003222/first-page-pdf ↩︎
ibid ↩︎
ibid ↩︎
Tim Davenport, Peter Howard and Christopher Dickinson, 1996. Mount Elgon National Park Biodiversity Report; and Simon Grove, 1995. A Nature Conservation Sourcebook for Forestry Professionals, 1995 ↩︎
Extracts from: NFA, 2006. A Guide to The Management of Uganda’s Tropical Moist Forests for Timber Production, and NFA, 2007. A Field Guide for Assessing and Restoring Growth and Development in Degraded Natural Forests in Uganda ↩︎
Adapted from: Mississippi State University, 2019. A Step-by-Step Guide to Taking Urban Forest Inventory Measurements, and NFA, 2008. A Field Guide To Exploratory Inventory In Uganda’s Tropical Moist Forests In Central Forest Reserves ↩︎
FAO Sustainable Forest Management (SFM) Toolbox. The Forest Inventory Module.
http://www.fao.org/sustainable-forest-management/toolbox/modules/forest-inventory/basic-knowledge/en/ ↩︎